Colouring books with local AI
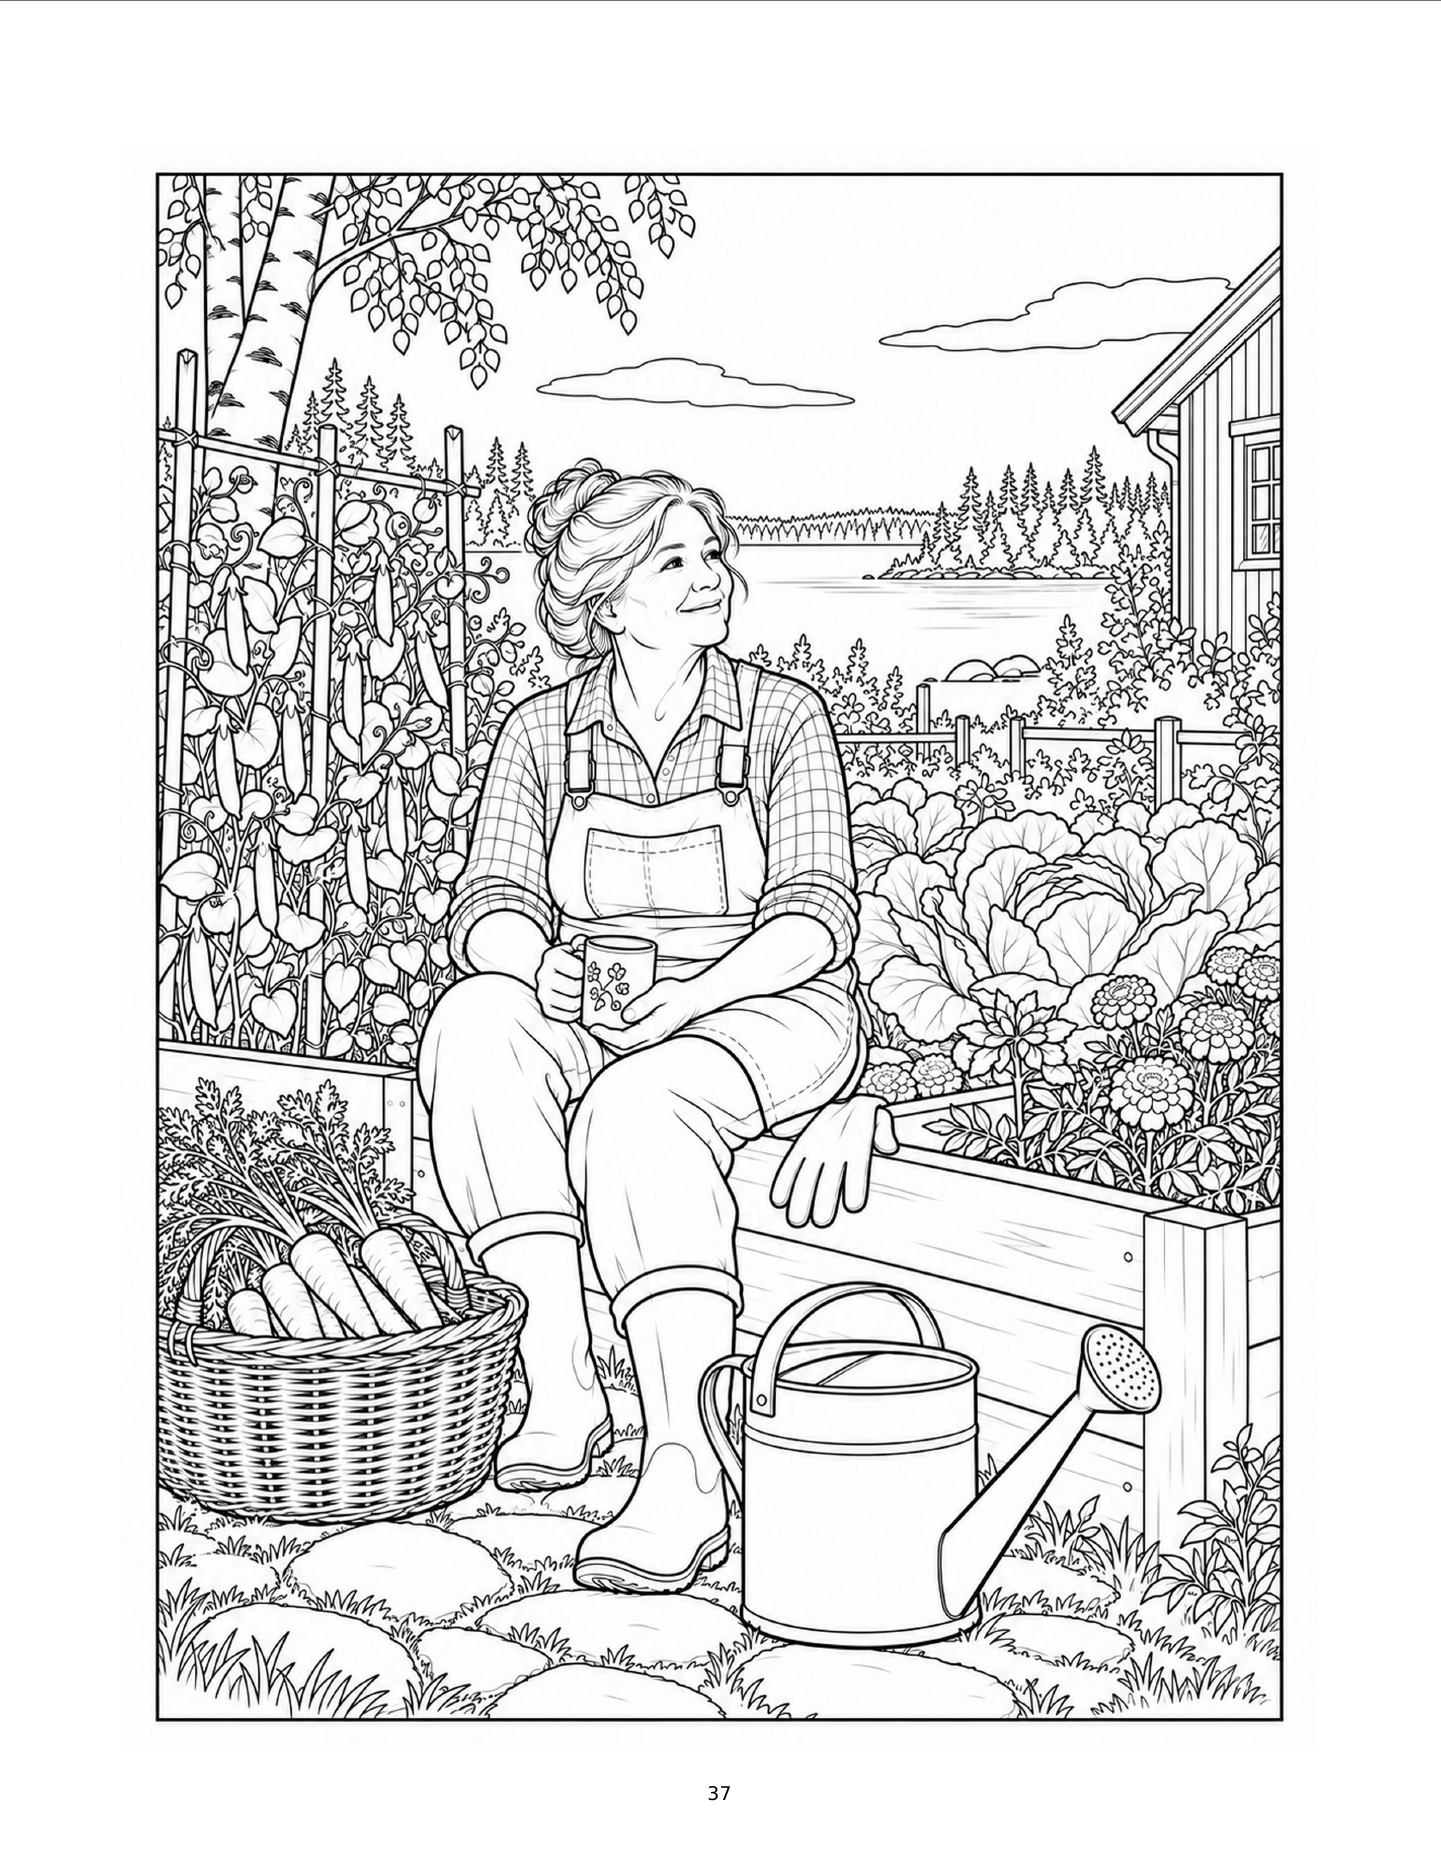
One colouring book is on sale and another is finished. Next, I want to speed up production without compromising quality.
Kristian Ratia
I usually have more projects than time. Some are programs, some are research experiments, some are physical things I've built, and some are things I wanted to try simply to see whether I could.
Not every project has to be finished, commercial or even useful. Often, the most interesting part is what you learn while doing it.
One colouring book is on sale and another is finished. Next, I want to speed up production without compromising quality.
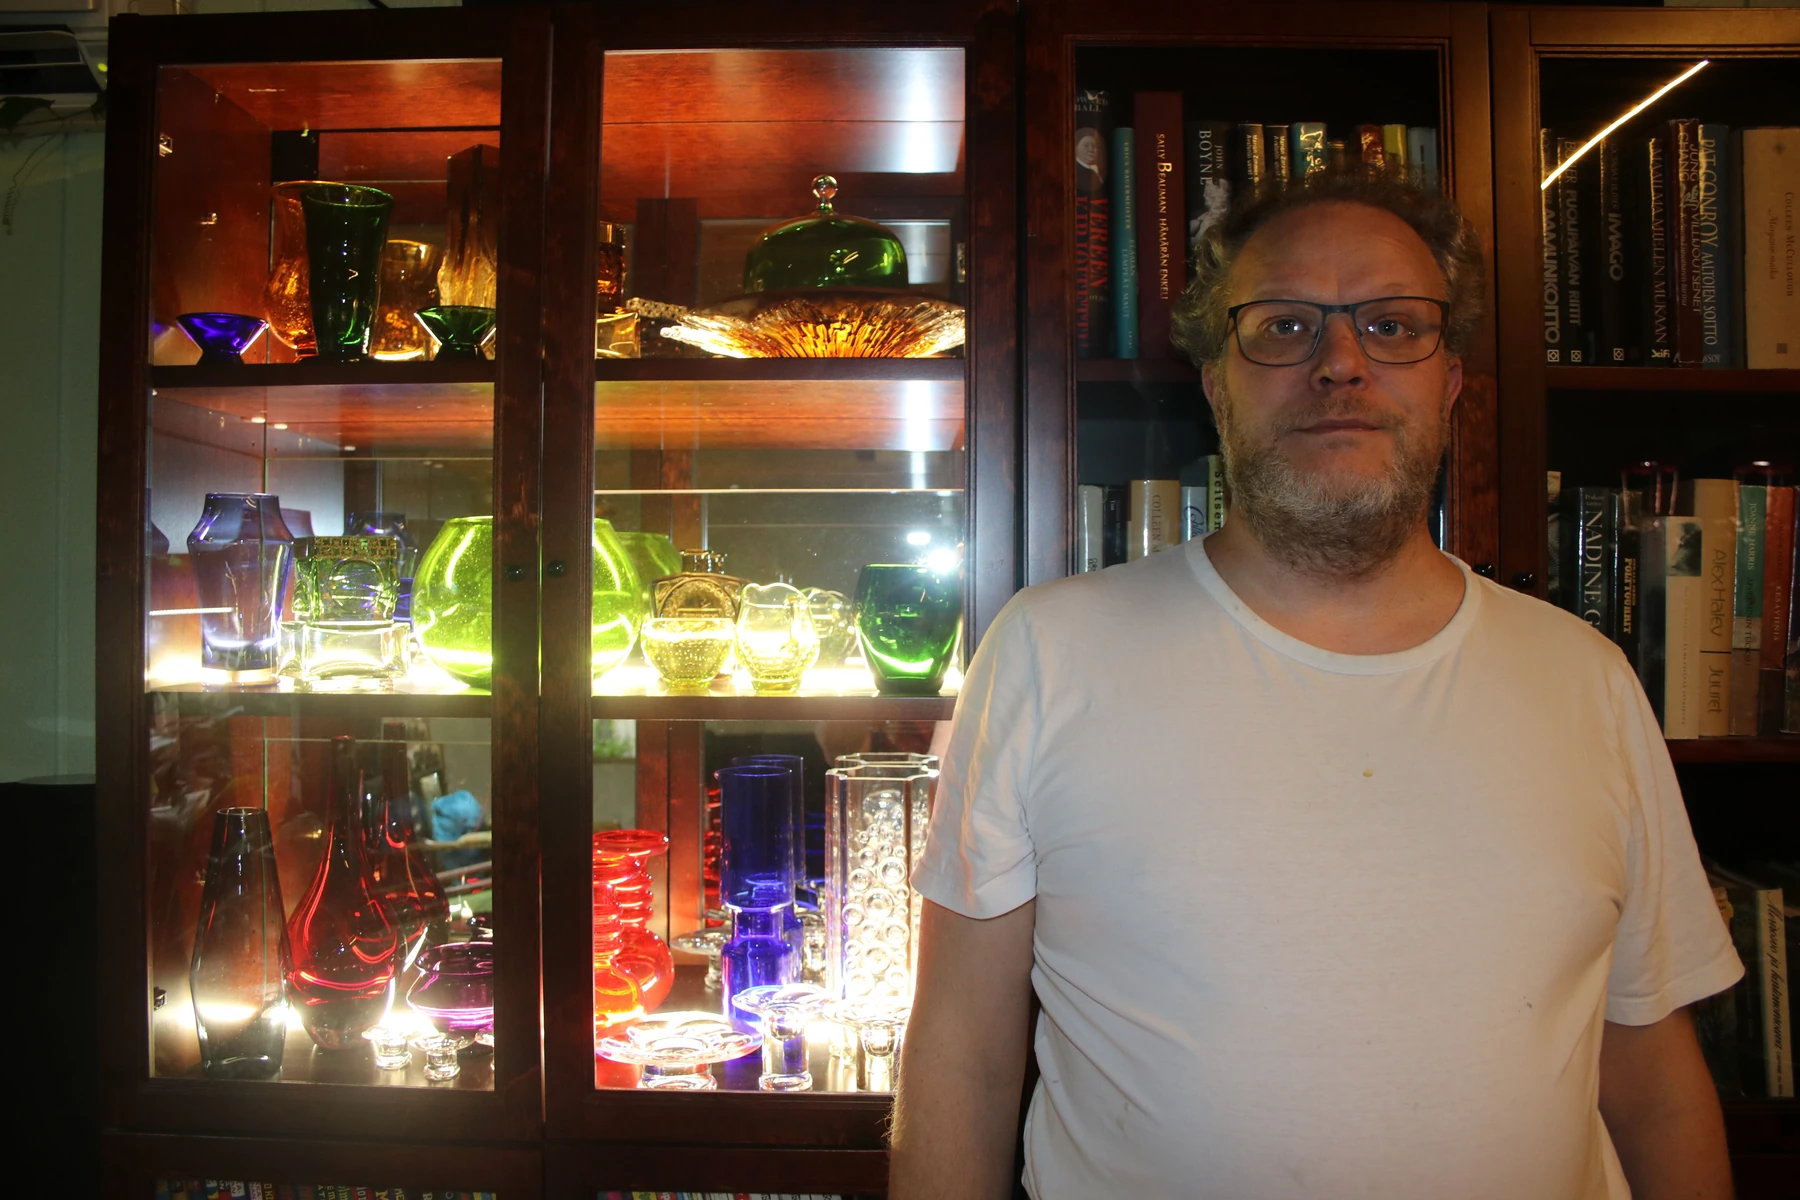
Mirrors and lights for a glass cabinet. Semi-reflective film was an interesting idea, but too dark for the final build.
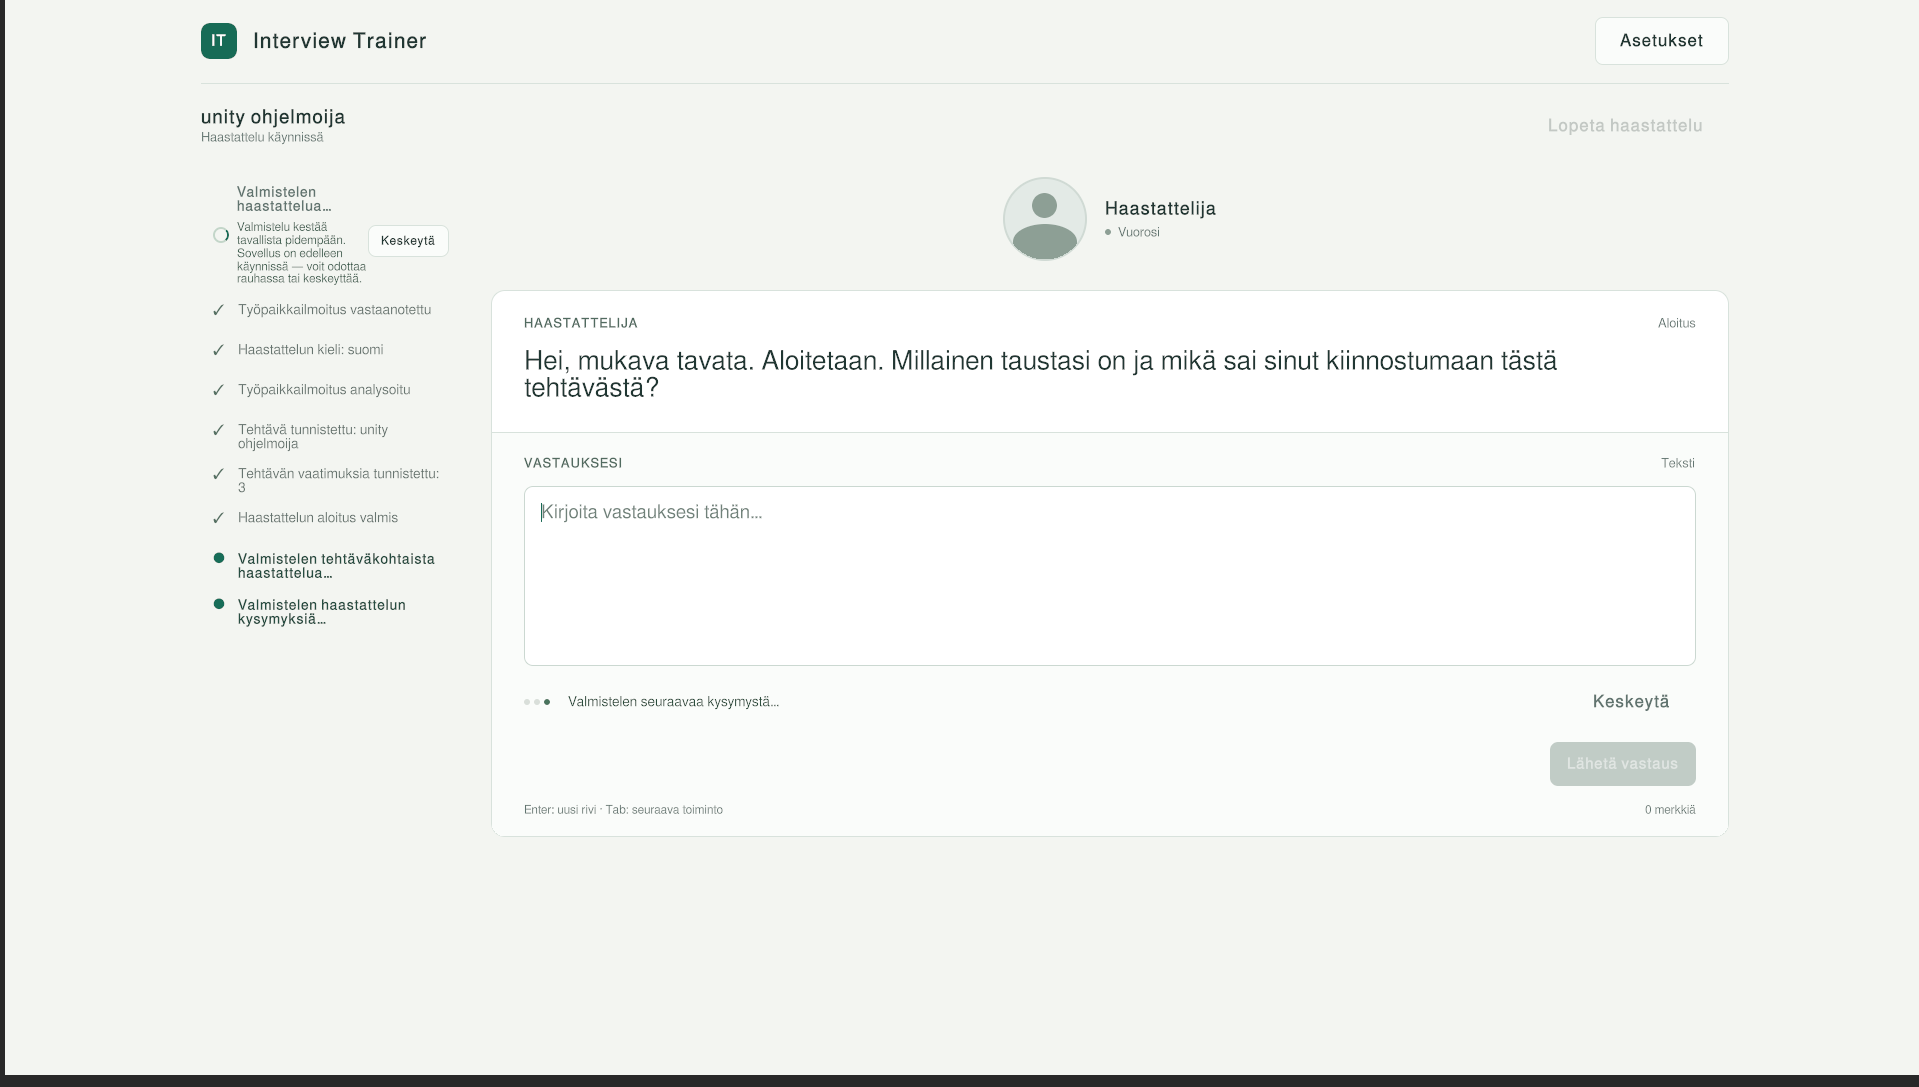
Job adverts become interview questions; answers receive feedback and suggestions for improvement.
My 2023 thesis and an upcoming, broader study of how well technical analysis works.
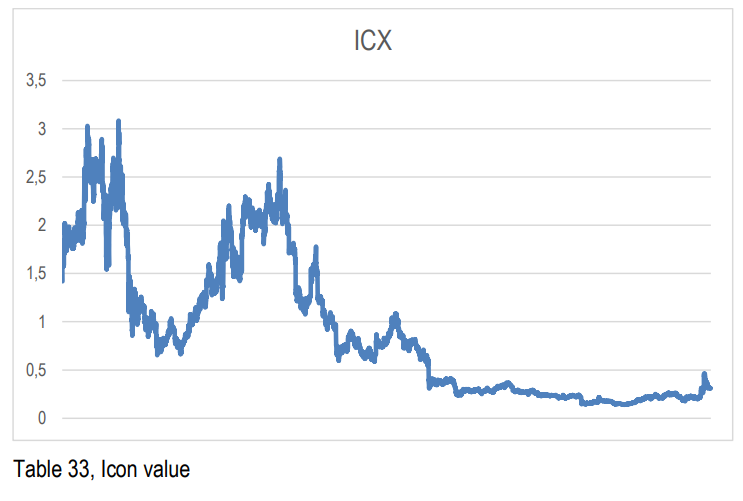
The chart is headed ICX and its original caption reads Table 33, Icon value. The vertical axis runs from 0 to 3.5. Neither the vertical axis unit nor the horizontal axis time period is labelled, so no assumptions are made about them. The curve has two high peaks near the start, a smaller rise in the middle and a low level at the end. It illustrates price variation, not the returns of a trading method or findings from the new research.
ChatGPT helps with lyrics and prompts; Suno makes the songs. Working title: Insinöörin onnellinen elämä (The Happy Life of an Engineer).
Read the story of the projectVideos of things I build, on my own channel. Making, experimenting and a little humour.
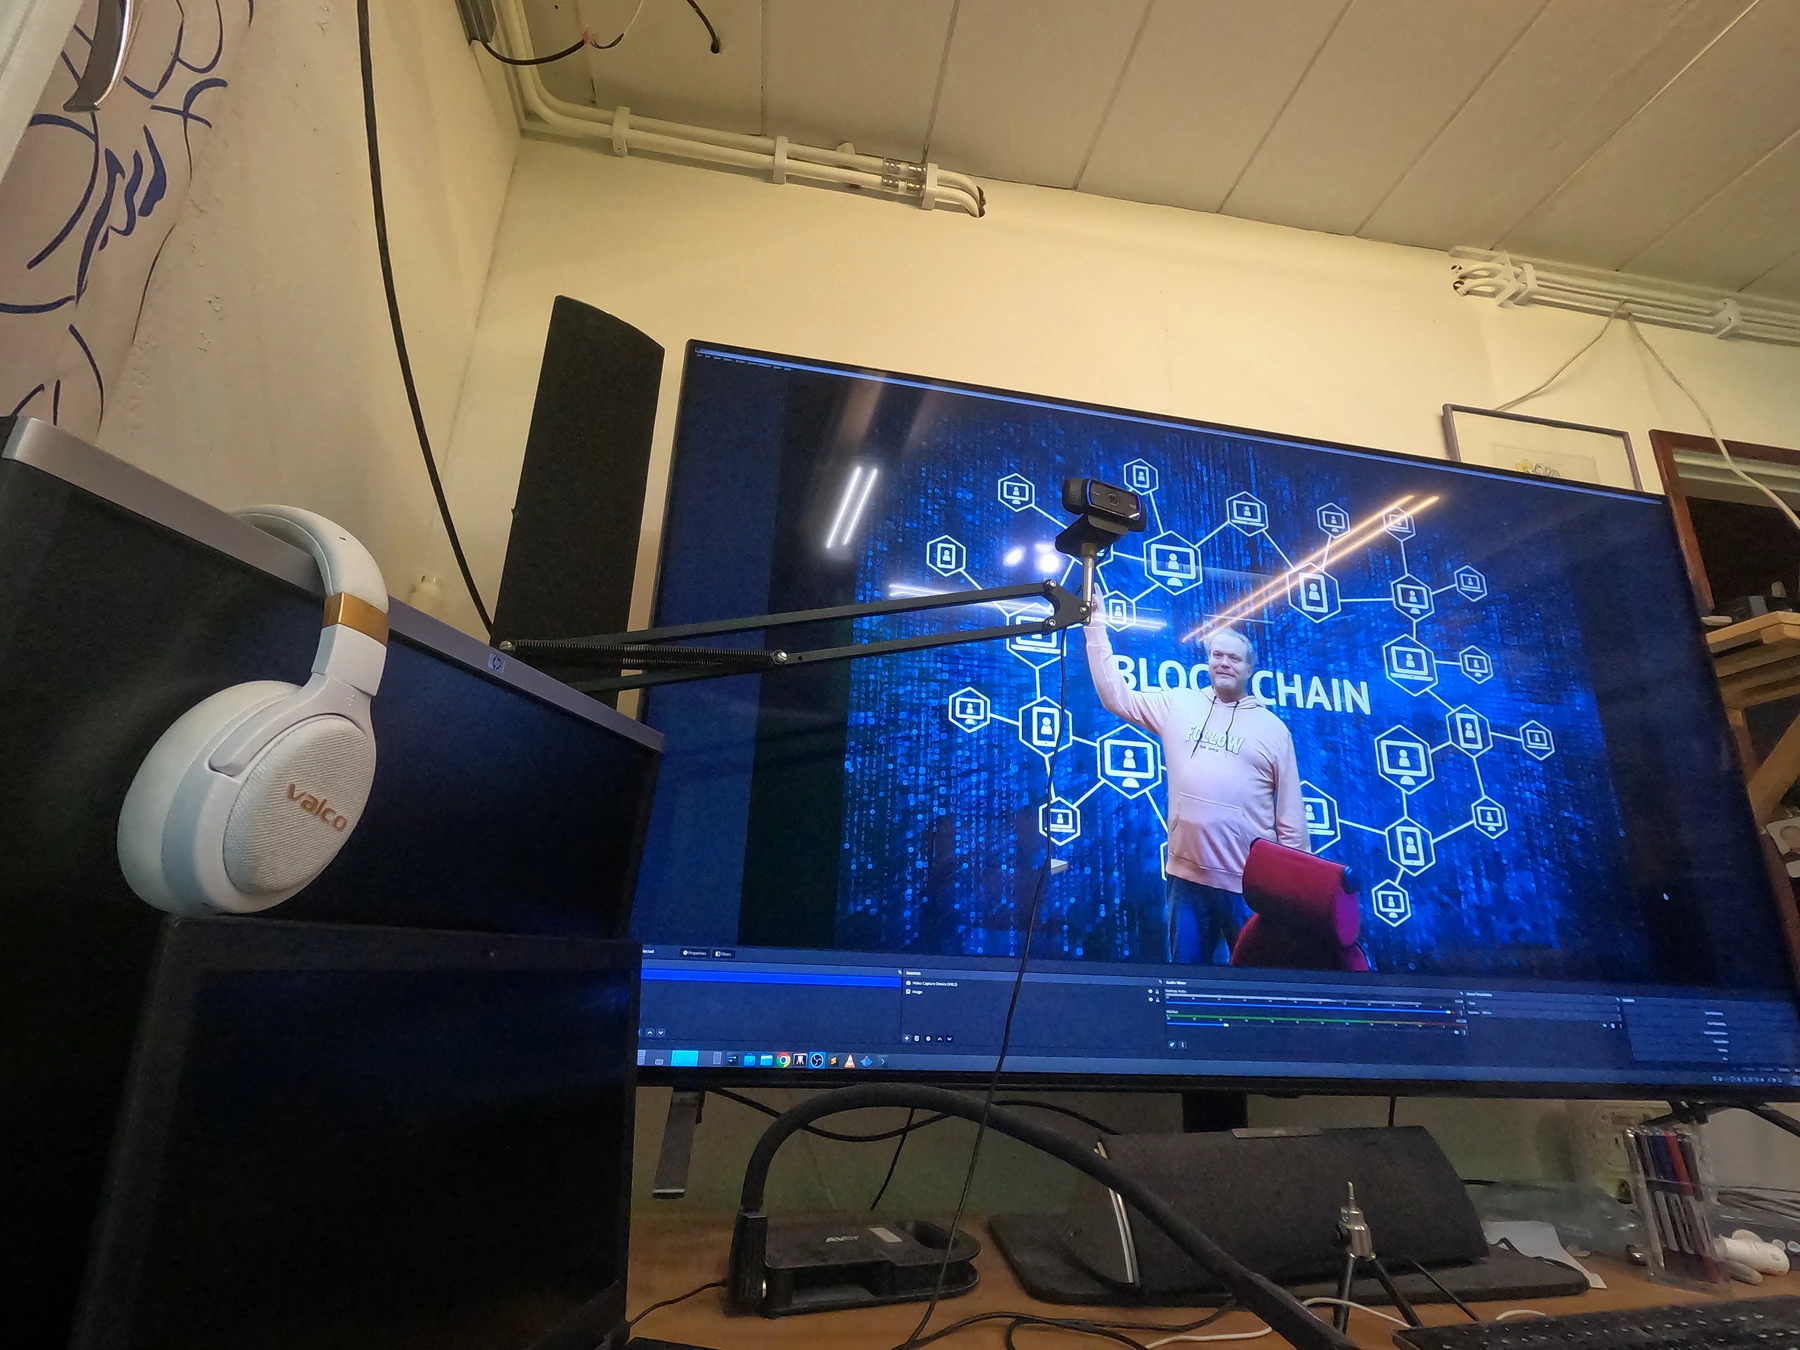
I could raise the blinds by hand. But why should I, if it could be automated?
Read how the idea came aboutA plan for a flow sensor and a Raspberry Pi alarm if a tap is left running.
Read how the idea came aboutNot everything I do fits into a handful of larger projects. Sometimes I try something simply because I want to understand how it works, or whether I could make it myself.
Raspberry Pi, electronics, local AI models, image generation and many smaller experiments may get their own introductions when there's something interesting to tell.
Not everything has to become a finished product. Sometimes an experiment lasts one evening. Sometimes it becomes a project that goes on for years.
Small experiments can have short write-ups. Larger projects get their own pages.